January 22, 2025
Knowledge Graphs Examples: Transforming Data into Valuable Insights

Ever wondered how Google seems to know exactly what you’re searching for? Or how Netflix suggests the perfect show to watch next? Behind these intelligent features lies a powerful technology called knowledge graphs. In this comprehensive guide, we’ll explore what a knowledge graph is, how it works, and why it’s revolutionizing the way we handle information in the digital age.

Key Takeaways:
- A knowledge graph is a structured data representation that shows relationships between entities like people, places, and concepts
- It uses nodes (entities) and edges (relationships) to organize information
- Major examples include Google Knowledge Graph, DBpedia, and Wikidata
- Knowledge graphs power many everyday technologies like search engines and recommendation systems
What is a knowledge graph? Definition
A knowledge graph is like a digital map of information that shows how different pieces of data are connected to each other. Imagine a spider web where each point represents something (like a person, place, or concept), and the threads between them show how they’re related.
Source: glass.ai
Key Components: Nodes and Edges
Knowledge graphs have two main parts:
- Nodes: These are the points in the graph that represent entities (people, places, objects, or concepts)
- Edges: These are the lines connecting nodes, showing how they’re related to each other
For example, in a business knowledge graph:
- A node might be “John Smith” (employee), “Marketing Department” (organization), or “New York Office” (place)
- An edge might show that “John Smith” (node) “works in” (edge) “Marketing Department” (node)
The Triple Format: How Information is Stored
Knowledge graphs store information in what’s called a “triple format”:
- Subject (a person, thing, or concept)
- Predicate (the relationship or action)
- Object (what the subject is connected to)
Example: “Shakespeare” (subject) “wrote” (predicate) “Hamlet” (object)
![]()
Read more about AI Knowledge Management: How AI is Used in Knowledge Management
![]()
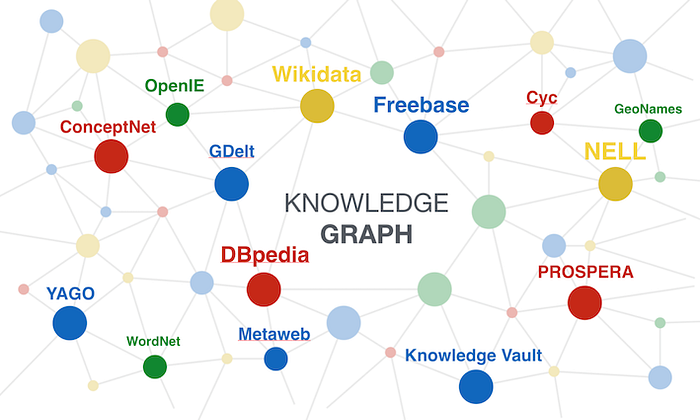
Knowledge Graphs Examples
Currently, there are several types of graphs developed by different companies for different purposes. Some small graphs have been primarily created to define user expectations for search systems within the organizations that created them. On the other hand, there are bigger knowledge graphs openly available to the public and used by millions of people to perform various online functions worldwide.
The following are the most common examples of big knowledge graphs:
Google announced its knowledge graph back in 2012 as a way to significantly improve the quality of search results returned by the company’s search engine. Google helped increase the interest of various academic and business communities in representing knowledge in the form of graphs, thus leading to the coinage of the term ‘knowledge graph’. Google’s graph was initially available only in English but has since been expanded to other languages such as Spanish, French, German, Russian, Japanese, and Italian.
Google’s graph is usually represented through Searching Engine Results Pages (SERPs) that provide information to millions of people around the world based on what they search. This graph comprises over 500 million objects sourced from Wikipedia, the CIA World Factbook, Freebase, and many other sources. The comprehensive nature of this graph makes it particularly useful among students and researchers looking to conduct extensive research on various topics.
Unfortunately, there is limited information regarding Google’s knowledge graph’s organization, size, and coverage. There are also limited means of using this graph outside Google’s devices and projects.
DBpedia
DBpedia’s knowledge graph leverages structured data from Wikipedia’s infoboxes. Its graph ontology mainly comprises entities such as people, organizations, books, films, species, places, creative works, diseases, and many others.
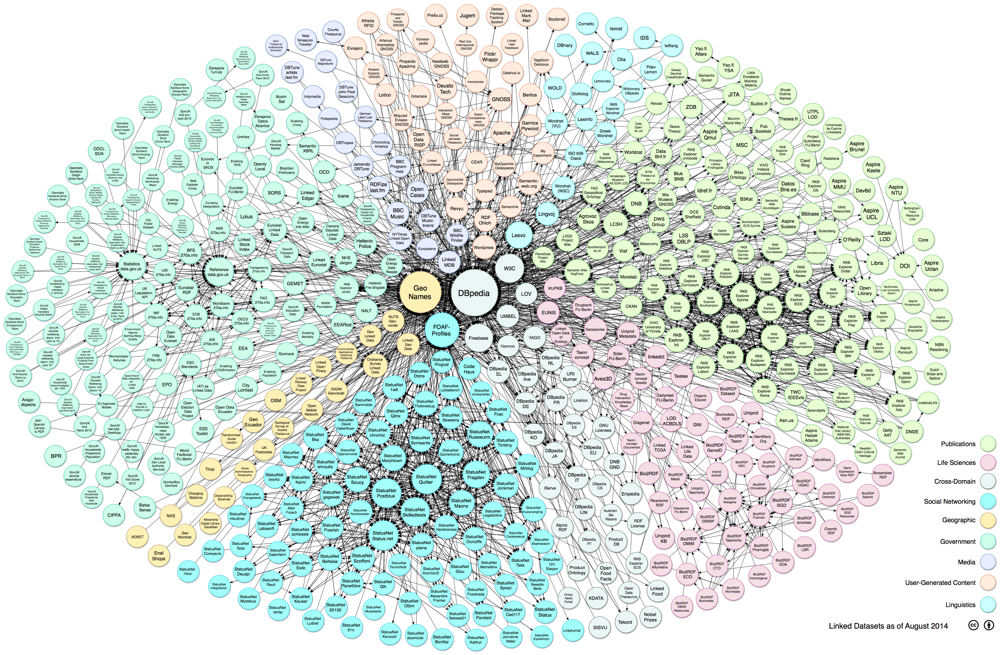
Source: medium.com
It’s important to note that DBpedia’s graph is the backbone of the LinkedIn Open Data (LOD) movement and has helped many organizations create their own knowledge graphs with millions of crowdsourced entries. Most importantly, both employers and job seekers can use this graph to their benefit.
For example, employers can use DBpedia to improve job descriptions by adding important details such as skills required, related occupations, and other information related to the respective industry. Job seekers, on the other hand, can use DBpedia to search for available job openings that match their qualifications and skills or those located in a specific area.
Wikidata
Wikidata is a free knowledge graph created by the Wikimedia Foundation. Unlike DBPedia, which comprises data from Wikipedia’s infoboxes, Wikidata mainly focuses on secondary and tertiary objects.
This multilingual and collaboratively edited knowledge graph contains millions of facts and statements that Wikipedia users and other entities can use under the Creative Commons (CC0) public domain license. [4] People worldwide can also use Wikidata to perform background checks on various individuals. Most importantly, the Wikidata serves as the primary source for various small graphs and allows anyone around the globe to contribute and improve the published information.
Here are some reasons why Wikidata is one of the most popular knowledge graphs out there:
- It is one of the largest knowledge graphs available in the world today.
- Despite being manually curated; the overall cost of curation is usually shared among a community of contributors.
- Wikidata editorial policies stipulate that all the data available on the graph must be easily understandable and verifiable.
- The graph makes a great effort to provide users with semantic definitions of all the different relation names through the vocabulary found in Schema.org. [5]
- Despite having several use cases, Wikidata’s primary use case is to improve web search across search engines.
WordNet
WordNet is undoubtedly one of the most popular and comprehensive knowledge graphs for the English language. This graph provides users with definitions, synonyms, antonyms, and hypernyms in more than 200 languages to help them understand the semantic relationships between various words.
WordNet’s graph is often used to enhance the efficiency of natural language processing and search applications. Anyone interested in gaining a deeper and more comprehensive understanding of the English language can use this graph for their personal needs.
GeoNames
GeoNames is an open and free geographical knowledge graph that provides its users with easy access to comprehensive information about geographical entities such as countries, cities, towns, mountains, hills, lakes, and rivers. This graph is commonly used for location-based searches, geographical analysis, and various mapping applications. The United States is the most covered country in GeoNames, followed by China, India, Norway, Mexico, and Russia. [6]
FactForge
FactForge is a popular knowledge graph that provides consumers of Linked Open Data with news articles about people, organizations, and places. This graph contains over 1 billion facts from other popular graphs such as DBpedia, WordNet, GeoNames, and the Panama Papers. It also comprises ontologies like the Financial Industry Business Ontology (FIBO) and live stream news articles linking world news to various entities, concepts, and ideas. [7]
In addition to providing users with thousands of news articles daily, FactForge contains sample queries about their unique capabilities in the media monitoring of interconnected entities and analysis of emerging industry trends.
Knowledge Graphs in Text Analysis
They have become increasingly important in enhancing the accuracy and effectiveness of text analysis tasks, such as relationship extraction, sentiment analysis, and text summarization.
Here are the various ways in which knowledge graphs are used in text analysis:
- The interconnectedness and relationships between different concepts and entities in graphs can be used to add context and ensure a more accurate interpretation of the meaning and intent of the text at hand.
- Linking textual content to concepts and entities in a graph helps provide better search results and further analytics of the available data.
- Representing underlying relationships between entities in a knowledge graph facilitates the extraction of complex relationships present in the text. This is vital for text analysis tasks like sentiment analysis and opinion mining.
- The data stored in KGs can be used as input data for text analysis tasks, thus improving them significantly.
- Facts extracted from textual data can be added to enrich graphs, making them better suited for data analysis, reporting, and visualization.
Application of Knowledge Graphs – Examples
1. Smart Content Recommendations
Knowledge graphs help services like Netflix and Spotify understand not just what you like, but why you like it. They connect information about:
- Your viewing/listening history
- Other users with similar tastes
- The characteristics of different content
- Current trends and popularity
2. Fraud Detection in Banking
Banks use knowledge graphs to spot suspicious activities by connecting dots between:
- Transaction patterns
- Account relationships
- Customer behaviors
- Known fraud schemes
3. Drug Discovery
In healthcare, knowledge graphs help researchers by:
- Connecting research papers with clinical trials
- Mapping relationships between genes, proteins, and diseases
- Identifying potential drug interactions
- Speeding up the development of new treatments
4. Enhanced Search Capabilities
Knowledge graphs make search engines smarter by:
- Understanding the context of your search
- Recognizing relationships between different topics
- Providing more relevant results
- Answering complex questions directly
Knowledge graphs and artificial intelligence
Although graphs and Artificial Intelligence (AI) are two different concepts, experts report that their combination is bound to result in advancements in the AI space. That said, here are the different ways in which KGs contribute to AI:
Machine learning enhancement
In the real world, most of the available data is usually unstructured. Although KGs can easily store and interpret such data, there is a huge risk in using unstructured data for machine learning tasks. Fortunately, KGs are capable of transforming unstructured data into a structured and machine-readable format using techniques like text mining and information extraction.
By doing so, AI and machine learning models can be trained on structured and semantically rich data generated by the graphs. This helps improve the learning capabilities of these models and their ability to understand complex relationships.
Data integration
As aforementioned, KGs can easily integrate and utilize data from different sources, providing a unified and structured representation of the data. Organizations can then utilize the unified data to develop advanced AI systems that can operate on large and complex datasets. [9]
Such systems help organizations improve operational efficiency through task automation and make informed decisions.
Frequently Asked Questions about Knowledge Graphs
Q: What makes a knowledge graph different from a regular database?
A: While databases store information in tables, knowledge graphs focus on relationships between data points, making it easier to discover connections and patterns.
Q: Can I create my own knowledge graph?
A: Yes! There are various tools and platforms available for creating knowledge graphs, ranging from simple desktop applications to enterprise-level solutions.
Q: How do companies use knowledge graphs?
A: Companies use knowledge graphs for various purposes, including improving search results, making recommendations, detecting fraud, and enhancing customer service.
Q: What are the main benefits of using knowledge graphs?
A: Knowledge graphs help organizations better understand their data, make smarter decisions, improve customer experiences, and develop more sophisticated AI applications.
Final thoughts
Knowledge graphs are transforming how we organize and use information in the digital age. They’re the invisible force behind many of the smart features we use daily, from search engines to recommendation systems. As artificial intelligence continues to evolve, knowledge graphs will play an increasingly important role in helping us make sense of the vast amount of data we create and consume.
Whether you’re a business leader, technologist, or simply curious about how modern technology works, understanding knowledge graphs is key to grasping the future of information management and artificial intelligence.
Contact us today for unparalleled innovation and strategic success through our specialized AI consulting services.
References
[1] W3.org. RDF. URL: https://www.w3.org/RDF/. Accessed on December 8, 2023
[2] IBM.com. Computer Vision. URL: https://www.ibm.com/topics/computer-vision. Accessed on December 8, 2023
[3] Semrush.com. SERP. URL: https://www.semrush.com/blog/serp/. Accessed on December 8, 2023
[4] Creativecommons.org. Public Domain. URL: https://creativecommons.org/public-domain/cc0/. Accessed on December 8, 2023
[5] Schema.org. URL: https://schema.org/. Accessed on December 8, 2023
[6] Medium.com. Places and their names — observations from 11 million place names. URL: https://medium.com/@tjukanov/places-and-their-names-observations-from-11-million-place-names-8ea34cf61da4. Accessed on December 8, 2023
[7] Openriskmanual. Org. Financial Industry Business Ontology. URL: https://shorturl.at/hloGI. Accessed on December 8, 2023
[8] Abmatic.ai. Benefits of Personalized Content Recommendations. URL: https://abmatic.ai/blog/benefits-of-personalized-content-recommendations. Accessed on December 8, 2023
[9] Dsstream.com. What is Unified Data: Definition, Importance, and Unification Process. URL: https://bit.ly/48atyl0. Accessed on December 8, 2023
Category: