March 10, 2026
What is a Data Engineering Pipeline?


A data engineering pipeline is an automated system that moves data from source systems — databases, applications, sensors, third-party APIs — into a destination like a data warehouse or analytics tool, cleaning and transforming it along the way. It replaces manual exports and one-off scripts with a repeatable, monitored process.
KEY TAKEAWAYS
When a Dedicated Pipeline Is Worth Building?
A dedicated pipeline earns its cost under three conditions: data comes from several sources that need to be combined reliably, the business needs updates hourly or in real time rather than monthly, or engineers are currently losing measurable time to manual exports and spreadsheet reconciliation.
That pressure is real and growing, 43% of IT decision-makers already say rising data volumes risk overwhelming their infrastructure.
It’s the wrong investment when there’s a single data source, updates only need to happen monthly, or the dataset is small enough for a no-code connector to handle end to end. Building custom infrastructure for that case adds ongoing maintenance cost without adding capability.
Where Pipelines Pay Off: Five Business Applications
Cutting Report Generation from 3 Days to 15 Minutes: Finance and Reporting
Manual month-end reporting means pulling data from separate ledgers, CRMs, and spreadsheets by hand, then reconciling mismatches before anyone can trust the numbers. A pipeline that automates that consolidation and validates totals at each stage can take a process that took a finance team from 3 days down to 15 minutes.
Real-Time Inventory Sync for Retail and E-commerce
Retailers running multiple sales channels need stock counts to match across all of them, or they oversell items already sold out elsewhere. A pipeline syncing point-of-sale, warehouse, and storefront data in near real time can process over 50,000 transactions per second during peak periods without falling behind.
Fraud Detection in Financial Services
Detecting fraud requires scoring activity as it happens, not after a nightly batch job flags it a day too late. Streaming pipelines built for this can evaluate more than 10 million transactions a day against risk models with sub-second latency.
Predictive Maintenance in Manufacturing
Sensor and IoT data from production lines only helps if it reaches an analytics layer before a failure, not after. Pipelines feeding predictive-maintenance models on machine telemetry have let manufacturing clients flag failing components days in advance of a breakdown.
Multi-Channel Marketing Attribution
Marketing teams tracking spend across five or more channels need one pipeline pulling all of it into a single model to see what’s driving revenue. Automating that consolidation has replaced a 5-person team’s weekly manual reconciliation with a daily automated refresh.
How Does a Data Pipeline Work?
Data pipelines automate the movement and transformation of data from source systems to destinations where it can be analyzed or fed into AI/ML applications. Modern pipelines typically include four core stages:
- Data ingestion. The pipeline extracts raw data from source systems — operational databases (PostgreSQL, MySQL, MongoDB), SaaS applications (Salesforce, HubSpot, Shopify), event streams (Kafka, Kinesis), files (S3, ADLS, GCS), or IoT sensors. Modern ingestion tools like Fivetran, Airbyte, and Stitch provide pre-built connectors for hundreds of common sources; for custom sources, engineers write extractors in Python or use frameworks like Apache Spark.
- Data transformation. Raw data is cleaned, deduplicated, joined, aggregated, and modeled into the shape needed for downstream use. Historically this happened in dedicated ETL tools (Informatica, Talend); today it’s increasingly handled inside the warehouse itself using dbt — a SQL-based transformation framework that has become an industry standard for the ELT pattern.
- Data storage. Transformed data lands in an analytical store: a data warehouse (Snowflake, BigQuery, Redshift), a data lake (S3, ADLS with open table formats like Delta Lake, Iceberg, or Hudi), or — increasingly — a data lakehouse (Databricks, Microsoft Fabric, Snowflake) that combines the strengths of both.
- Monitoring and observability. A production pipeline is only as good as your ability to detect when it breaks. Modern data observability platforms (Monte Carlo, Bigeye, Soda, Datafold) continuously track freshness, volume, schema changes, and data-quality metrics — alerting engineers when something drifts before downstream consumers are affected.
ETL vs ELT: which pattern should you use?
There are two dominant patterns for moving and transforming data:
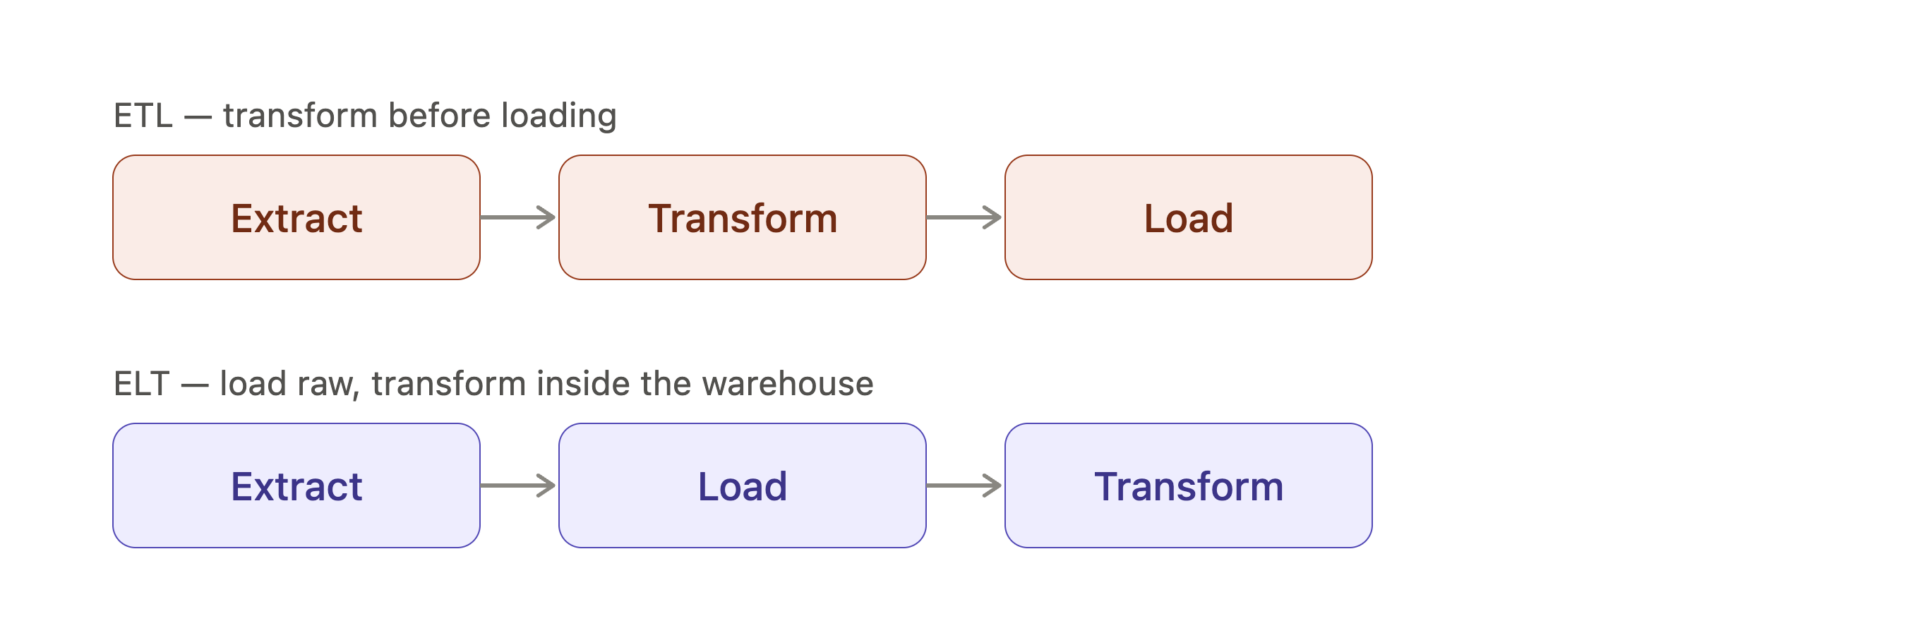
- ETL (Extract → Transform → Load). The classical pattern: data is extracted from source systems, transformed in a dedicated processing layer, and then loaded into the target system. This was the only practical approach when warehouses were expensive and computationally limited.
- ELT (Extract → Load → Transform). The modern pattern: data is extracted and loaded raw into the warehouse first, then transformed in place using SQL. This became dominant once modern cloud warehouses like Snowflake, BigQuery, and Databricks SQL made compute cheap and elastic.
| Dimension | ETL | ELT |
|---|---|---|
| Transformation location | Outside the warehouse, in a dedicated tool | Inside the warehouse, using SQL |
| Raw data access | Lost after transformation | Always preserved |
| Iteration speed | Slower — pipeline changes require redeploying ETL jobs | Faster — engineers iterate on SQL, with version control |
| Best for | Highly sensitive data, regulated environments, legacy systems | Most new projects in 2026 |
| Typical tools | Informatica, Talend, SSIS, custom Python | dbt + Snowflake/BigQuery/Databricks, Fivetran or Airbyte |
The 2026 default: for greenfield projects, the modern data stack — Fivetran or Airbyte for ingestion → cloud warehouse for storage → dbt for transformation — has become the most common architecture.
ETL is still valid in regulated environments where data masking must happen before loading, or in legacy organizations with substantial Informatica/Talend investment.
Types of data pipelines: batch, streaming, and hybrid
Batch pipelines
Move data on a schedule — typically nightly, hourly, or every few minutes. The dominant batch orchestration tool in 2026 is Apache Airflow, with Dagster and Prefect as modern alternatives. dbt is almost universally used for the transformation step.
Streaming pipelines
Move data in real time, as events occur. Used for fraud detection, real-time personalization, IoT analytics, and operational dashboards. The dominant building blocks are Apache Kafka for event transport, Apache Flink or Spark Structured Streaming for processing, and Apache Iceberg or Delta Lake as the streaming-friendly storage layer. The trade-off for lower latency is reliability: messages can sit too long in a queue or get dropped, which is why message brokers rely on acknowledgement.
Micro-batch and near-real-time pipelines
Sit between the two — moving data every few seconds to minutes. Tools like Snowflake Snowpipe Streaming, Materialize, and dbt incremental models make this pattern increasingly common.
Hybrid pipelines (Lambda and Kappa architectures)
The classical Lambda architecture runs two parallel tracks — a fast streaming track for approximate, real-time results and a slower batch track for accurate, historical results — merged at query time. The simpler Kappa architecture treats everything as a stream, replaying historical data when needed. In 2026, Kappa is usually preferred for greenfield builds, while Lambda persists where legacy batch systems can’t be retired.
Designing a Data Pipeline: An 8-Step Process
Choosing ETL vs ELT and batch vs streaming answers what kind of pipeline you need. Actually building one follows a consistent sequence:
- Define your objectives. Pin down what value the business wants and which use cases the pipeline needs to serve. Skipping this is the most common reason pipelines get rebuilt within a year.
- Map your data sources. List every system that will feed the pipeline and the format each one produces.
- Choose your ingestion strategy. Decide, source by source, batch vs real-time, and managed connector vs custom extractor.
- Design the processing plan. Decide what needs cleaning, deduplication, or masking, and where that logic will live.
- Set up the storage system. Choose between a warehouse, a lake, or a lakehouse — expensive to reverse, so validate against the processing plan first.
- Plan the workflow and its dependencies. Map which jobs must finish before others start — technical dependencies (queue → validation → destination) or business-oriented ones (cross-check against a second source first).
- Build monitoring and governance. Decide what gets monitored, who owns alerts, and how compliance checks get enforced.
- Design the consumption layer. Confirm which BI tools, ML pipelines, or applications will query the final data.
Pitfalls and Honest Trade-offs
Every design choice earlier in this guide comes with a trade-off that rarely shows up during the build — only after the pipeline has been running for a while.
- Data consistency in streaming setups. To get data moving in seconds instead of hours, a stream gives up some consistency guarantees along the way. In practice that means two dashboards, both technically “live,” can show slightly different numbers if queried a second apart — one has already received an update the other hasn’t propagated yet. It’s rarely a bug; it’s the mechanism working as designed, and it only becomes a problem when nobody on the team expects it and someone escalates a “data discrepancy” that isn’t one.
- Cost from unoptimized queries. This is the trade-off that hides the longest. A pipeline built on poorly written SQL — a transformation that scans an entire table when it only needed the last day’s rows, a join that isn’t indexed — doesn’t fail on day one. It just runs, quietly, at a slightly higher compute cost than it should. That gap compounds as data volume grows, month over month, until a team opens their cloud bill a year in and finds a pipeline that used to cost a few hundred dollars a month now costs several thousand, with no single change they can point to — just accumulated inefficiency nobody was watching for.
- Schema drift breaking the pipeline. This one is genuinely hard to catch without deliberately building for it. Source systems change — a field gets renamed, a data type shifts from integer to string, a vendor updates their API. A pipeline that isn’t built to detect it doesn’t throw a clear error; it keeps running, but the data flowing through it is now subtly wrong. Because nothing crashes, this can sit in a warehouse for weeks — until an analyst notices a report doesn’t add up and starts tracing it backward.
- Skipping monitoring to save time upfront. This is the most expensive shortcut on this list, precisely because it’s invisible until it isn’t. A pipeline with alerting and one without look completely identical on the surface — both deliver data, both power the same dashboards, both seem fine in every demo. The difference only shows up the day something breaks: the monitored pipeline pages an engineer within minutes; the unmonitored one fails silently, and the first anyone hears about it is a week later, when someone asks why last week’s numbers look off and the honest answer is that a whole week of data never arrived.
The Modern Data Stack: tools and platforms in 2026
| Stage | Tool | What it does |
|---|---|---|
| Ingestion (batch) | Fivetran, Airbyte, Stitch | Pre-built connectors for hundreds of SaaS and database sources |
| Ingestion (streaming) | Apache Kafka, Amazon Kinesis, Google Pub/Sub | Real-time event transport |
| Storage (warehouse) | Snowflake, BigQuery, Redshift, Microsoft Fabric | Cloud-native analytical databases |
| Storage (data lakehouse) | Databricks, Snowflake (Iceberg tables), Microsoft Fabric | Unified warehouse + lake architecture |
| Open table formats | Delta Lake, Apache Iceberg, Apache Hudi | ACID transactions on lake storage |
| Transformation | dbt, SQLMesh, Dataform | SQL-based, version-controlled transformations |
| Streaming processing | Apache Flink, Spark Structured Streaming | Real-time data transformation |
| Orchestration | Apache Airflow, Dagster, Prefect | Scheduling, dependencies, retries |
| Observability | Monte Carlo, Bigeye, Soda, Datafold | Detect freshness, volume, schema, and quality issues |
| Data catalog & lineage | Atlan, DataHub, Collibra, Alation | Document data assets and trace lineage |
| Reverse ETL | Hightouch, Census | Push warehouse data back into SaaS tools |
AI and data pipelines: what’s changed in 2026
Two shifts have reshaped data engineering in the past few years:
- AI workloads demand higher-quality pipelines than BI ever did. LLM-based assistants, RAG systems, and AI agents depend on cleaner, fresher, more reliably governed data than traditional BI. This has elevated observability, lineage, and quality testing from “nice to have” to “production-critical.”
- AI is now part of the pipeline itself. Automated anomaly detection powered by ML, natural-language data exploration, AI-assisted development (Cursor, Copilot, Claude Code), agentic troubleshooting, and vector pipelines for RAG are all now standard categories.
Final Thoughts
A well-designed data pipeline is the foundation of nearly every modern business capability — BI, advanced analytics, machine learning, and generative AI. The teams that succeed in 2026 are the ones who worked through the design process deliberately before investing in observability and governance from day one.
If a pipeline like this needs to get built, or a legacy one needs modernizing, Addepto’s data engineering services team designs pipelines matched to your specific mix of sources, latency needs, and budget — including migrations onto Databricks and ongoing data governance and observability. The best way to start is a 30-minute call, not a proposal written in the dark, you can book one with our team here.
FAQ
What's the difference between a data pipeline and ETL?


ETL (Extract, Transform, Load) is a specific type of data pipeline pattern — one of several. A data pipeline is the broader concept: any automated flow of data from source to destination. ETL pipelines transform data before loading; ELT pipelines load raw data and transform inside the warehouse; streaming pipelines move data in real time; reverse ETL pipelines push data from the warehouse back to SaaS tools. All are types of data pipelines.
What's the difference between a data pipeline and an ETL tool?
A pipeline is the end-to-end flow; an ETL tool (or any single tool) is one component within it. A typical modern pipeline uses several tools: Fivetran for ingestion, dbt for transformation, Snowflake for storage, Airflow for orchestration, Monte Carlo for observability. No single tool builds a complete pipeline; engineers compose them.
How long does it take to build a data pipeline?
A simple pipeline (one source → warehouse → one dashboard) using modern tools (Fivetran, dbt, Snowflake, Airflow) can be live in 1–2 weeks. Enterprise pipelines with multiple sources, complex transformations, real-time components, and full observability typically take 2–6 months for the initial build, with ongoing iteration. The biggest determinant of timeline isn’t the technology — it’s the quality and accessibility of source data and the clarity of the business requirements.
Do I need to know coding to build a data pipeline?
For modern pipelines, you’ll need SQL (essential, especially with dbt as the dominant transformation tool) and ideally Python (for custom ingestion, orchestration, and integrations). No-code and low-code tools like Fivetran, Airbyte, and Hightouch reduce the coding required for ingestion and reverse ETL, but the transformation and orchestration layers still benefit from engineers comfortable with code. The bar is much lower than it was 10 years ago, but it’s not zero.
What is a data pipeline architecture?
A data pipeline architecture is the high-level design of how data flows through the system — which sources feed into which storage, how transformations are organized, whether the pipeline is batch or streaming, and how observability and governance are layered on top. Common architectures include the Lambda architecture (parallel batch and streaming tracks), the Kappa architecture (everything as a stream), the Medallion architecture popularized by Databricks (Bronze → Silver → Gold layers of progressively cleaner data), and the Data Mesh (federated, domain-owned data products). The right architecture depends on scale, latency requirements, and team structure.
What is data observability and why does it matter?
Data observability is the practice of continuously monitoring data quality, freshness, volume, schema, and lineage in production — the “monitoring” equivalent for data engineering. Without it, pipeline issues are discovered when downstream consumers (analysts, executives, AI applications) notice wrong numbers — usually after damage has been done. With it, engineers catch issues at the source before they propagate. Leading tools include Monte Carlo, Bigeye, Soda, and Datafold.
How much does a modern data pipeline cost?
For a small team running a basic modern stack (Fivetran + Snowflake + dbt + Airflow), costs typically fall in the $1,000–$5,000 per month range, dominated by warehouse compute. Enterprise pipelines with many sources, streaming components, observability, and cataloging can easily reach $20,000–$200,000+ per month. The largest cost variable is usually warehouse compute, not the orchestration or ingestion tools — and that cost is heavily influenced by transformation design (incremental models, clustering, partitioning).
How does a data pipeline support AI and machine learning?
AI and ML workloads need the same data foundations as BI, but with stricter quality, freshness, and governance requirements. A robust data pipeline provides ML teams with clean, well-cataloged feature data; powers RAG systems that ground LLMs in proprietary documents; feeds vector databases that LLM applications query; and supplies the evaluation datasets that monitor model performance in production. Companies whose data pipelines are weak find their AI initiatives stall at the pilot stage — not because the model fails, but because the data underneath it isn’t reliable enough.
Category: